

- The correlation matrix highlighted a reason why Bitcoin is the king of crypto.
- The sentiment over the weekend has been bearish, and was partially why crypto is down.
The crypto market saw some joy after the brutal losses on the 5th of August. The altcoin market cap went from a low of $466 billion on the 5th of August to $580 billion on the 8th of August, a 24.6% bounce.
Over the weekend, this trend began to slowly reverse. Across different sectors, from memes to AI and DeFi, prices fell slowly. The major reason why crypto is down is due to Bitcoin [BTC], which posted losses worth 6% on the 11th of August.
Where Bitcoin goes, the market usually follows
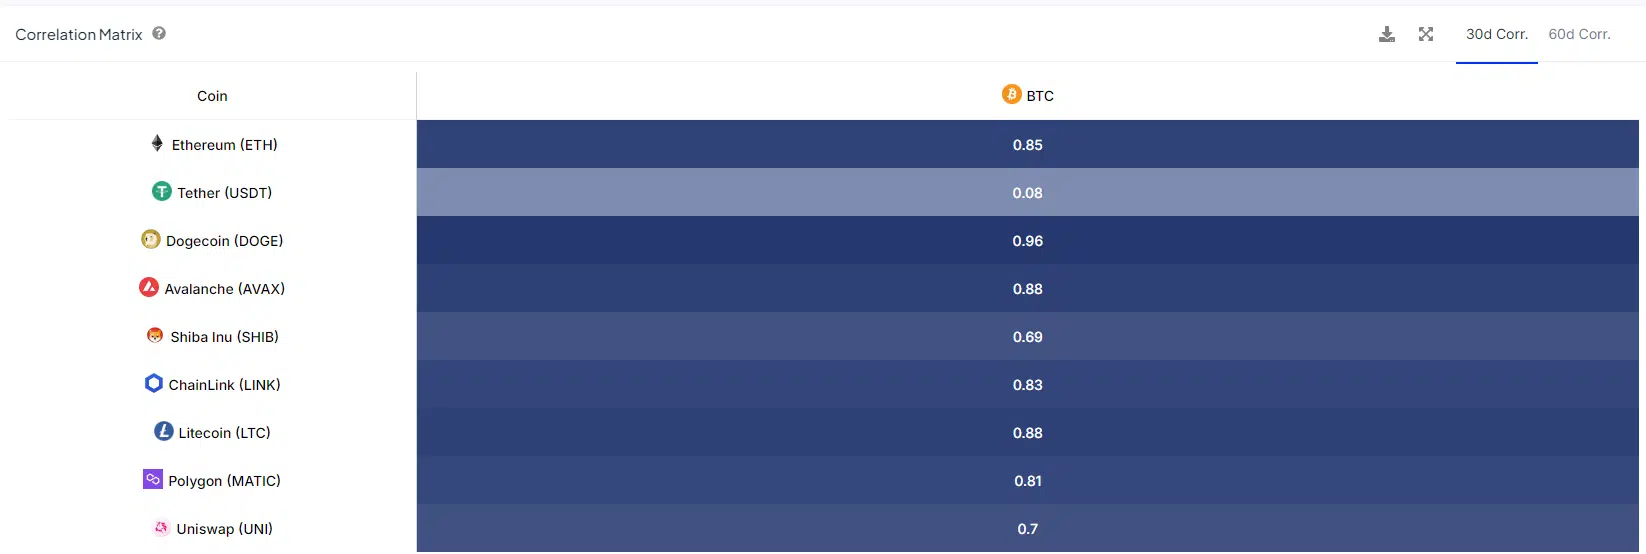
Source: IntoTheBlock
The correlation matrix above of Bitcoin and some large-cap altcoins showed a strong positive correlation. This meant that the price of these major assets would move in tandem with BTC, although it might not move the same amount.
This is also why trading altcoins is sometimes referred to as trading levered BTC.
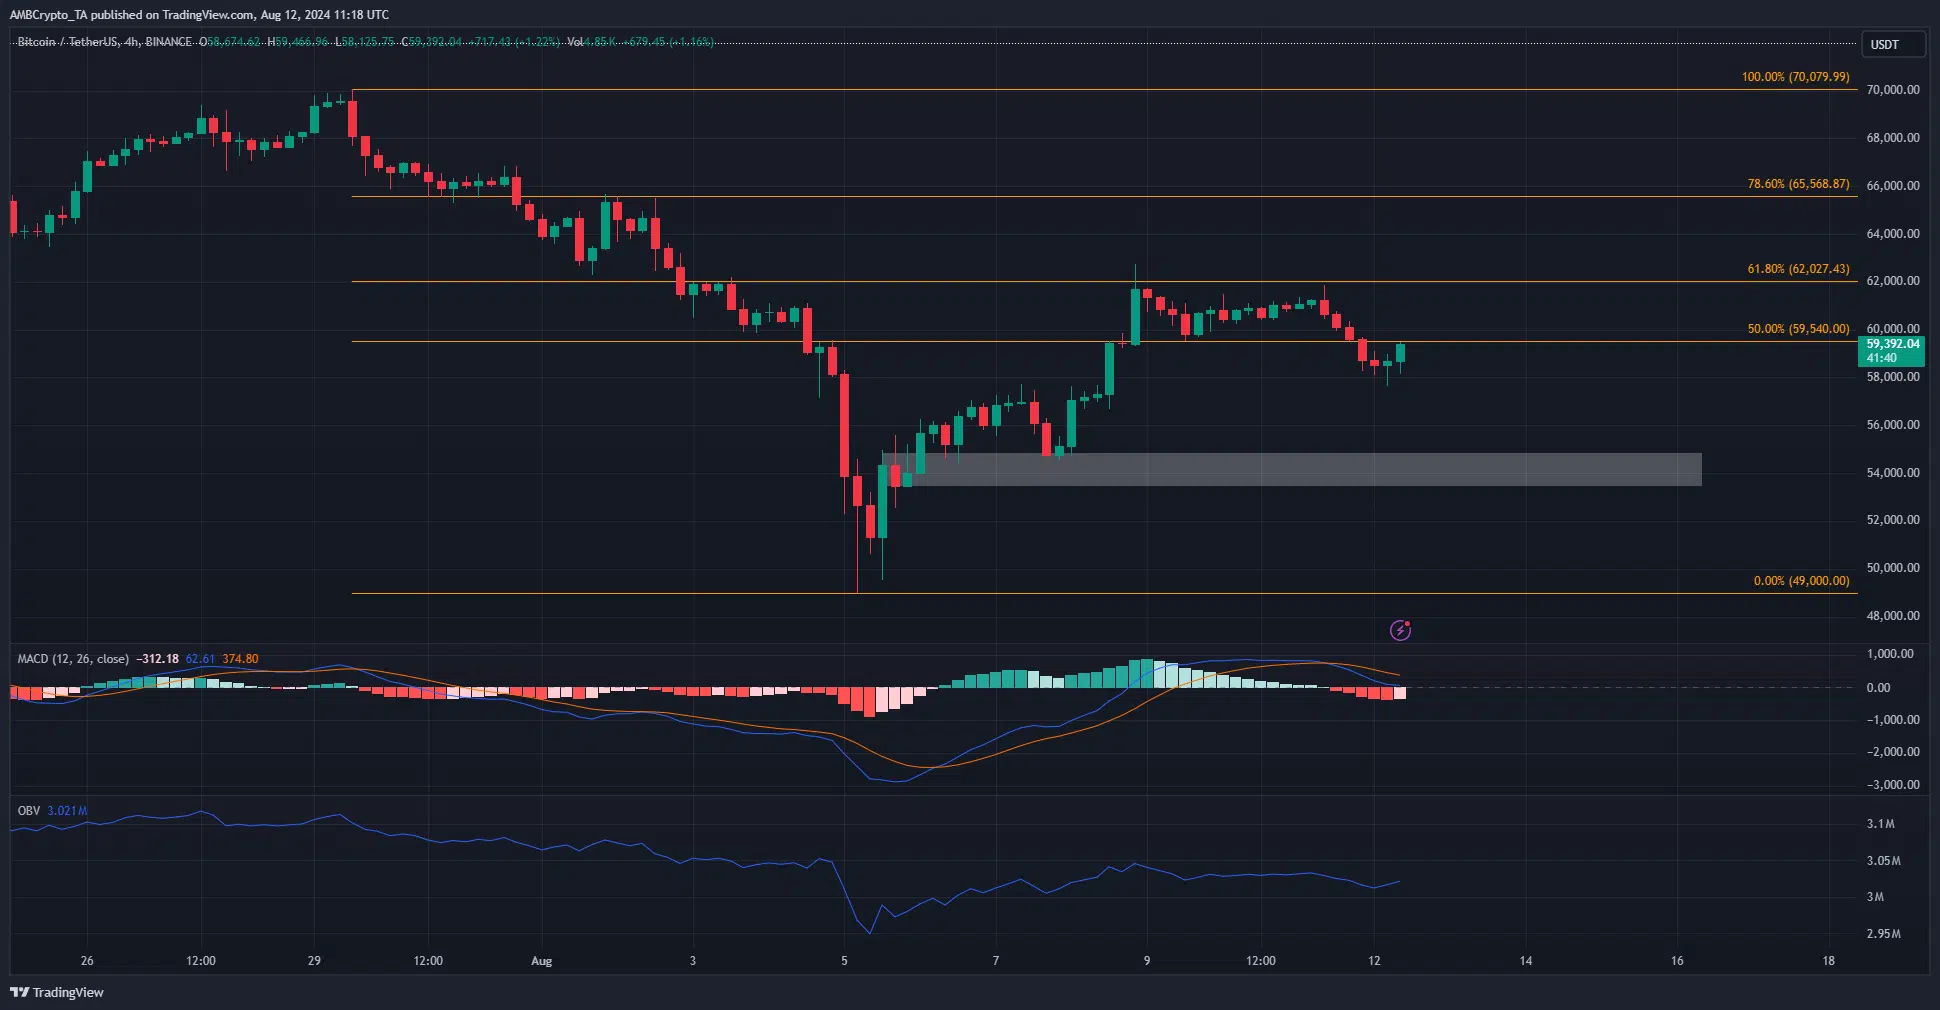
Source: BTC/USDT on TradingView
Based on the price drop of BTC last week, a set of Fibonacci levels (orange) were plotted. They showed that the 61.8% retracement level at $62k and the 50% retracement level at $59.5k are the next resistances.
In this timeframe, Bitcoin has a bearish market structure. The MACD formed a bearish crossover, and the OBV began to slide lower over the past three days.
So why is BTC down?
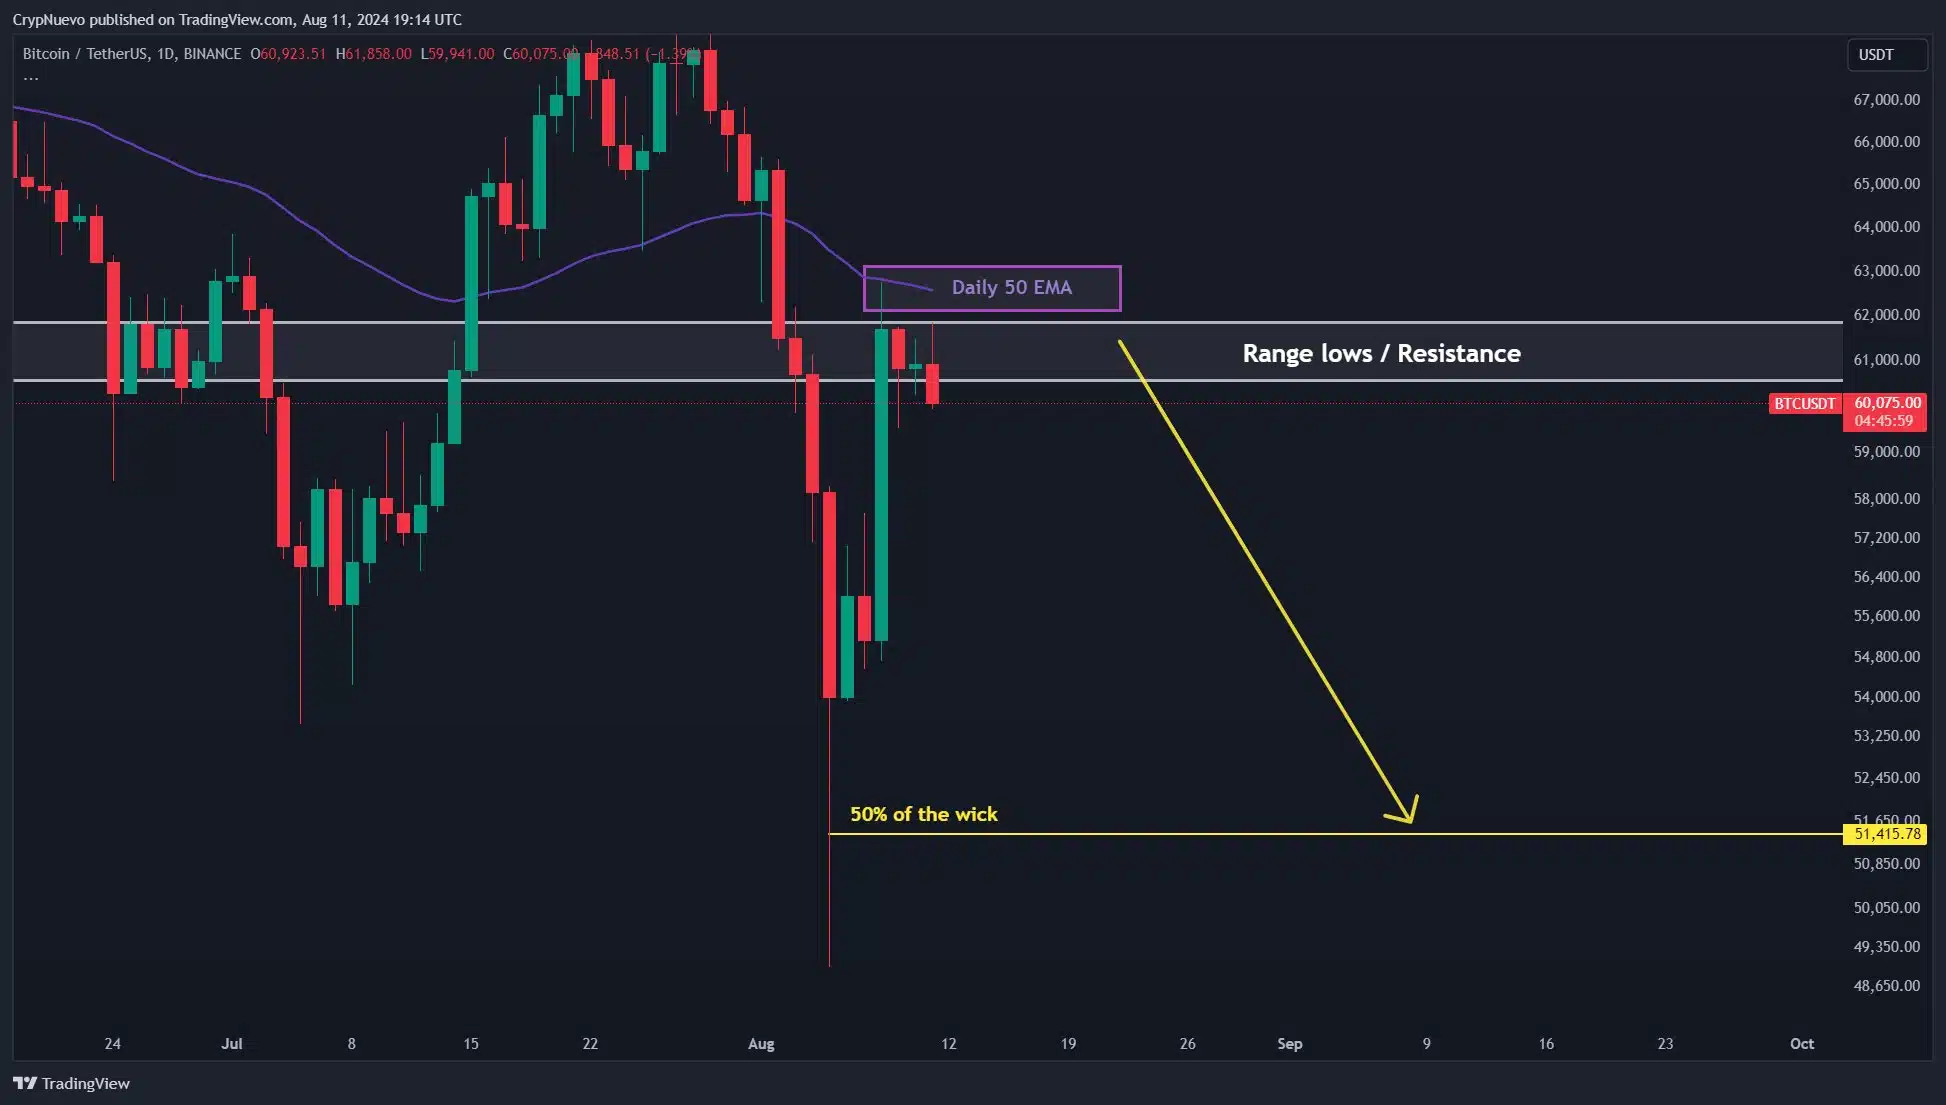
Source: CrypNuevo on X
Crypto analyst CrypNuevo noted that the $61k region is both the former range lows and has confluence with the daily 50 EMA. This could see a short-term move above $61k before a downside reversal as prices search for liquidity.
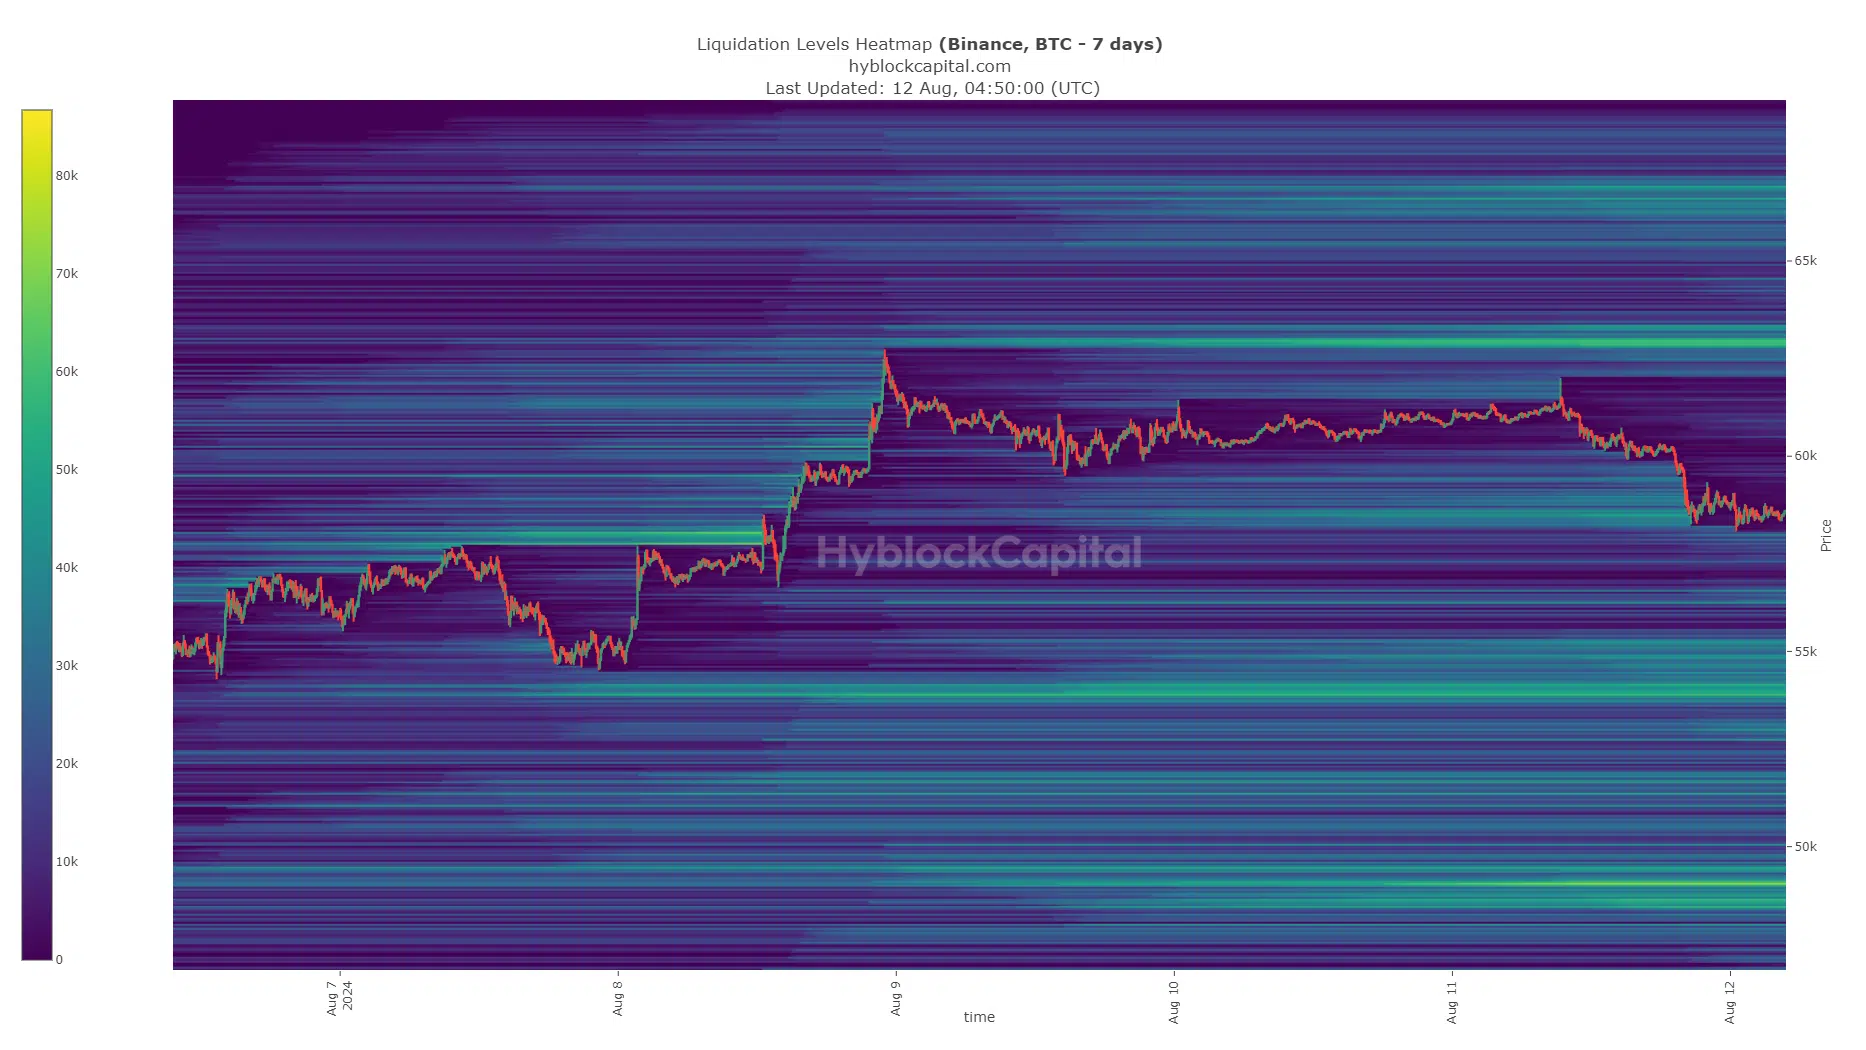
Source: Hyblock
Read Bitcoin’s [BTC] Price Prediction 2024-25
The liquidation map also agreed with these findings. To the north, the $63k level was the bullish target. To the south, the liquidity pockets at $54k and $49k are the targets.
In the next week or two, it is quite likely that BTC will revisit the lows it set last Monday, or at least approach close to them. Hence, the $53k region could be pivotal for BTC and the crypto market.
Read More: Why is crypto down today? Bitcoin’s 6% loss, unpacked
Disclaimer:The information provided on this website does not constitute investment advice, financial advice, trading advice, or any other sort of advice and you should not treat any of the website’s content as such. coinzoop.com does not recommend that any cryptocurrency should be bought, sold, or held by you. Do conduct your own due diligence and consult your financial advisor before making any investment decisions.