


- BNB’s price currently trends within a descending triangle.
- The demand for the altcoin must increase for it to break above the upper line of this triangle.
Binance Coin [BNB] has trended downward since its price peaked at $612 on 27th May to form a descending triangle. As of this writing, the altcoin traded at $593.11, recording a 3% price dip in the past three days.
BNB at a crossroads
At its current price, Binance Coin traded slightly below the lower line of the descending triangle, which forms support.
For a rally towards the upper line of this triangle (resistance level) to be actualized, there has to be a surge in buying pressure.
In the current market, readings from BNB’s key momentum indicators showed that neither the buyers nor sellers were exerting enough pressure to drive the trend in their direction.
BNB’s Relative Strength Index (RSI) was 49.50, while its Money Flow Index (MFI) was 56.60. A combined reading of the values of these indicators showed that price movement is balanced between gains and losses, with neither the bears nor bulls having clear dominance.
This consolidation was confirmed by BNB’s Average True Range (ATR), whose value has dropped by 23% since 23rd May.
This indicator measures market volatility by calculating the average range between high and low prices over a specified number of periods.
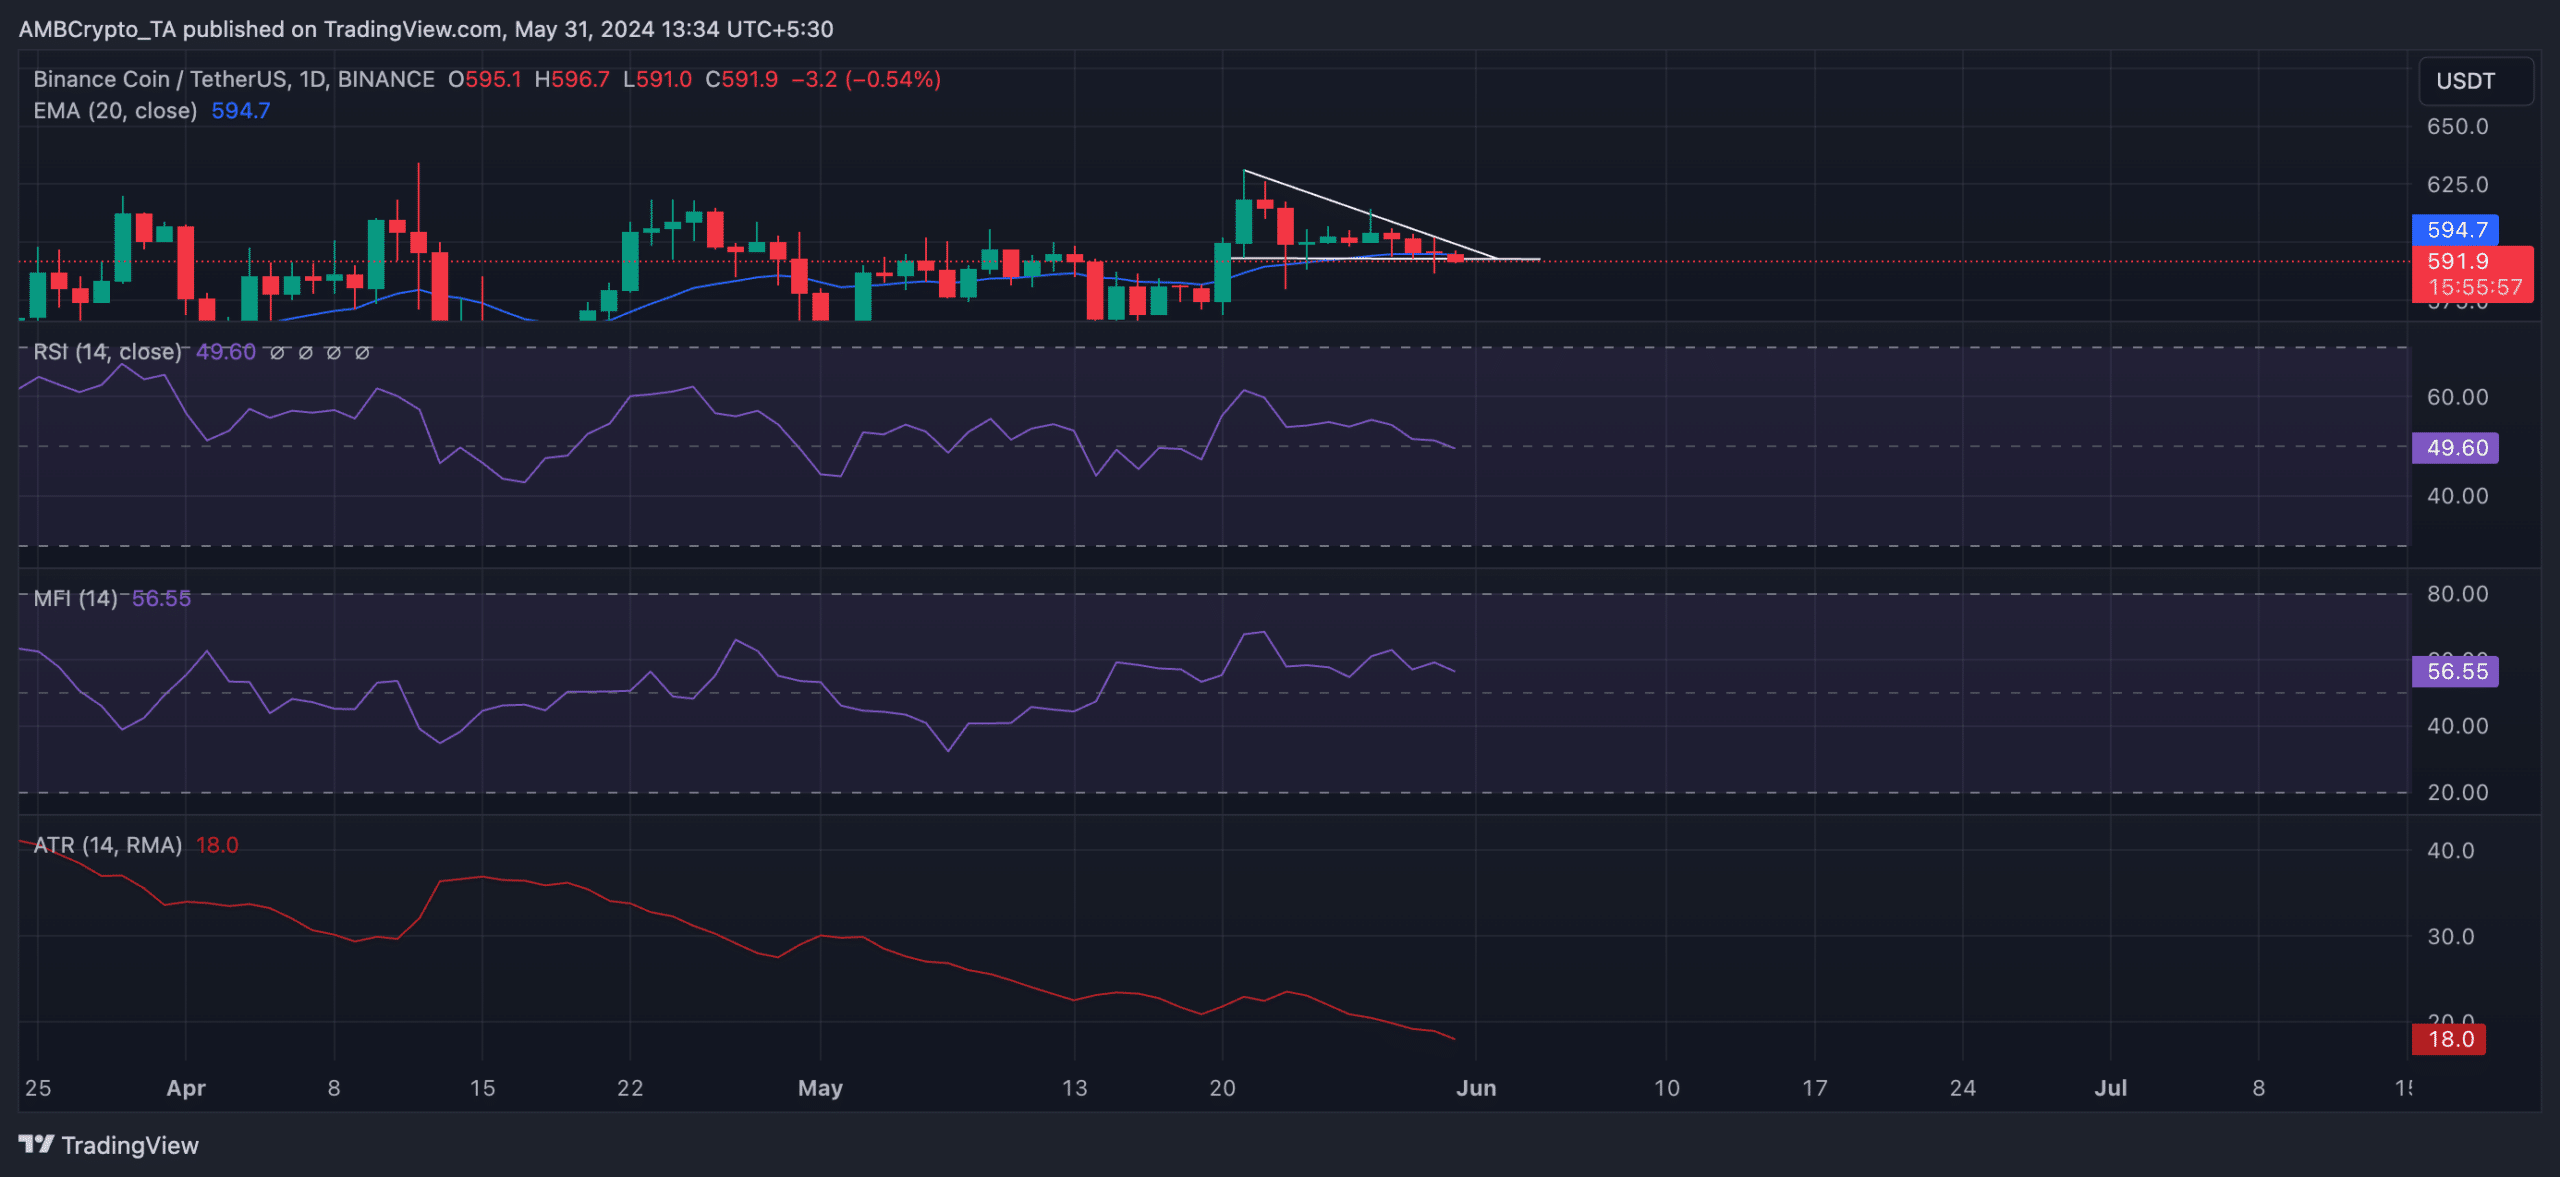
Source: BNB/USDT, TradingView
When it declines this way, it suggests that an asset’s price is becoming less volatile and the market is entering a consolidation phase.
BNB bulls stand a chance
Although there is a seeming balance between supply and demand in the BNB market, AMBCrypto’s assessment revealed some indicators that affirmed the bullish bias for the altcoin.
For example, BNB’s Chaikin Money Flow (CMF) rested above its zero line at press time. This indicator measures how money flows into and out of the BNB market. At 0.05, BNB’s CMF suggested that there was still a demand for the altcoin.
Readings from BNB’s Parabolic SAR confirmed this trend. As of this writing, the dots that make up this indicator rested under BNB’s price, hinting at the possibility of a short-term price surge.
Read Binance [BNB] Price Prediction 2023-2024
Lastly, BNB trades slightly above its 20-day Exponential Moving Average at its current price. This means that its current price is higher than its average price in the past 20 days, albeit by a little difference.
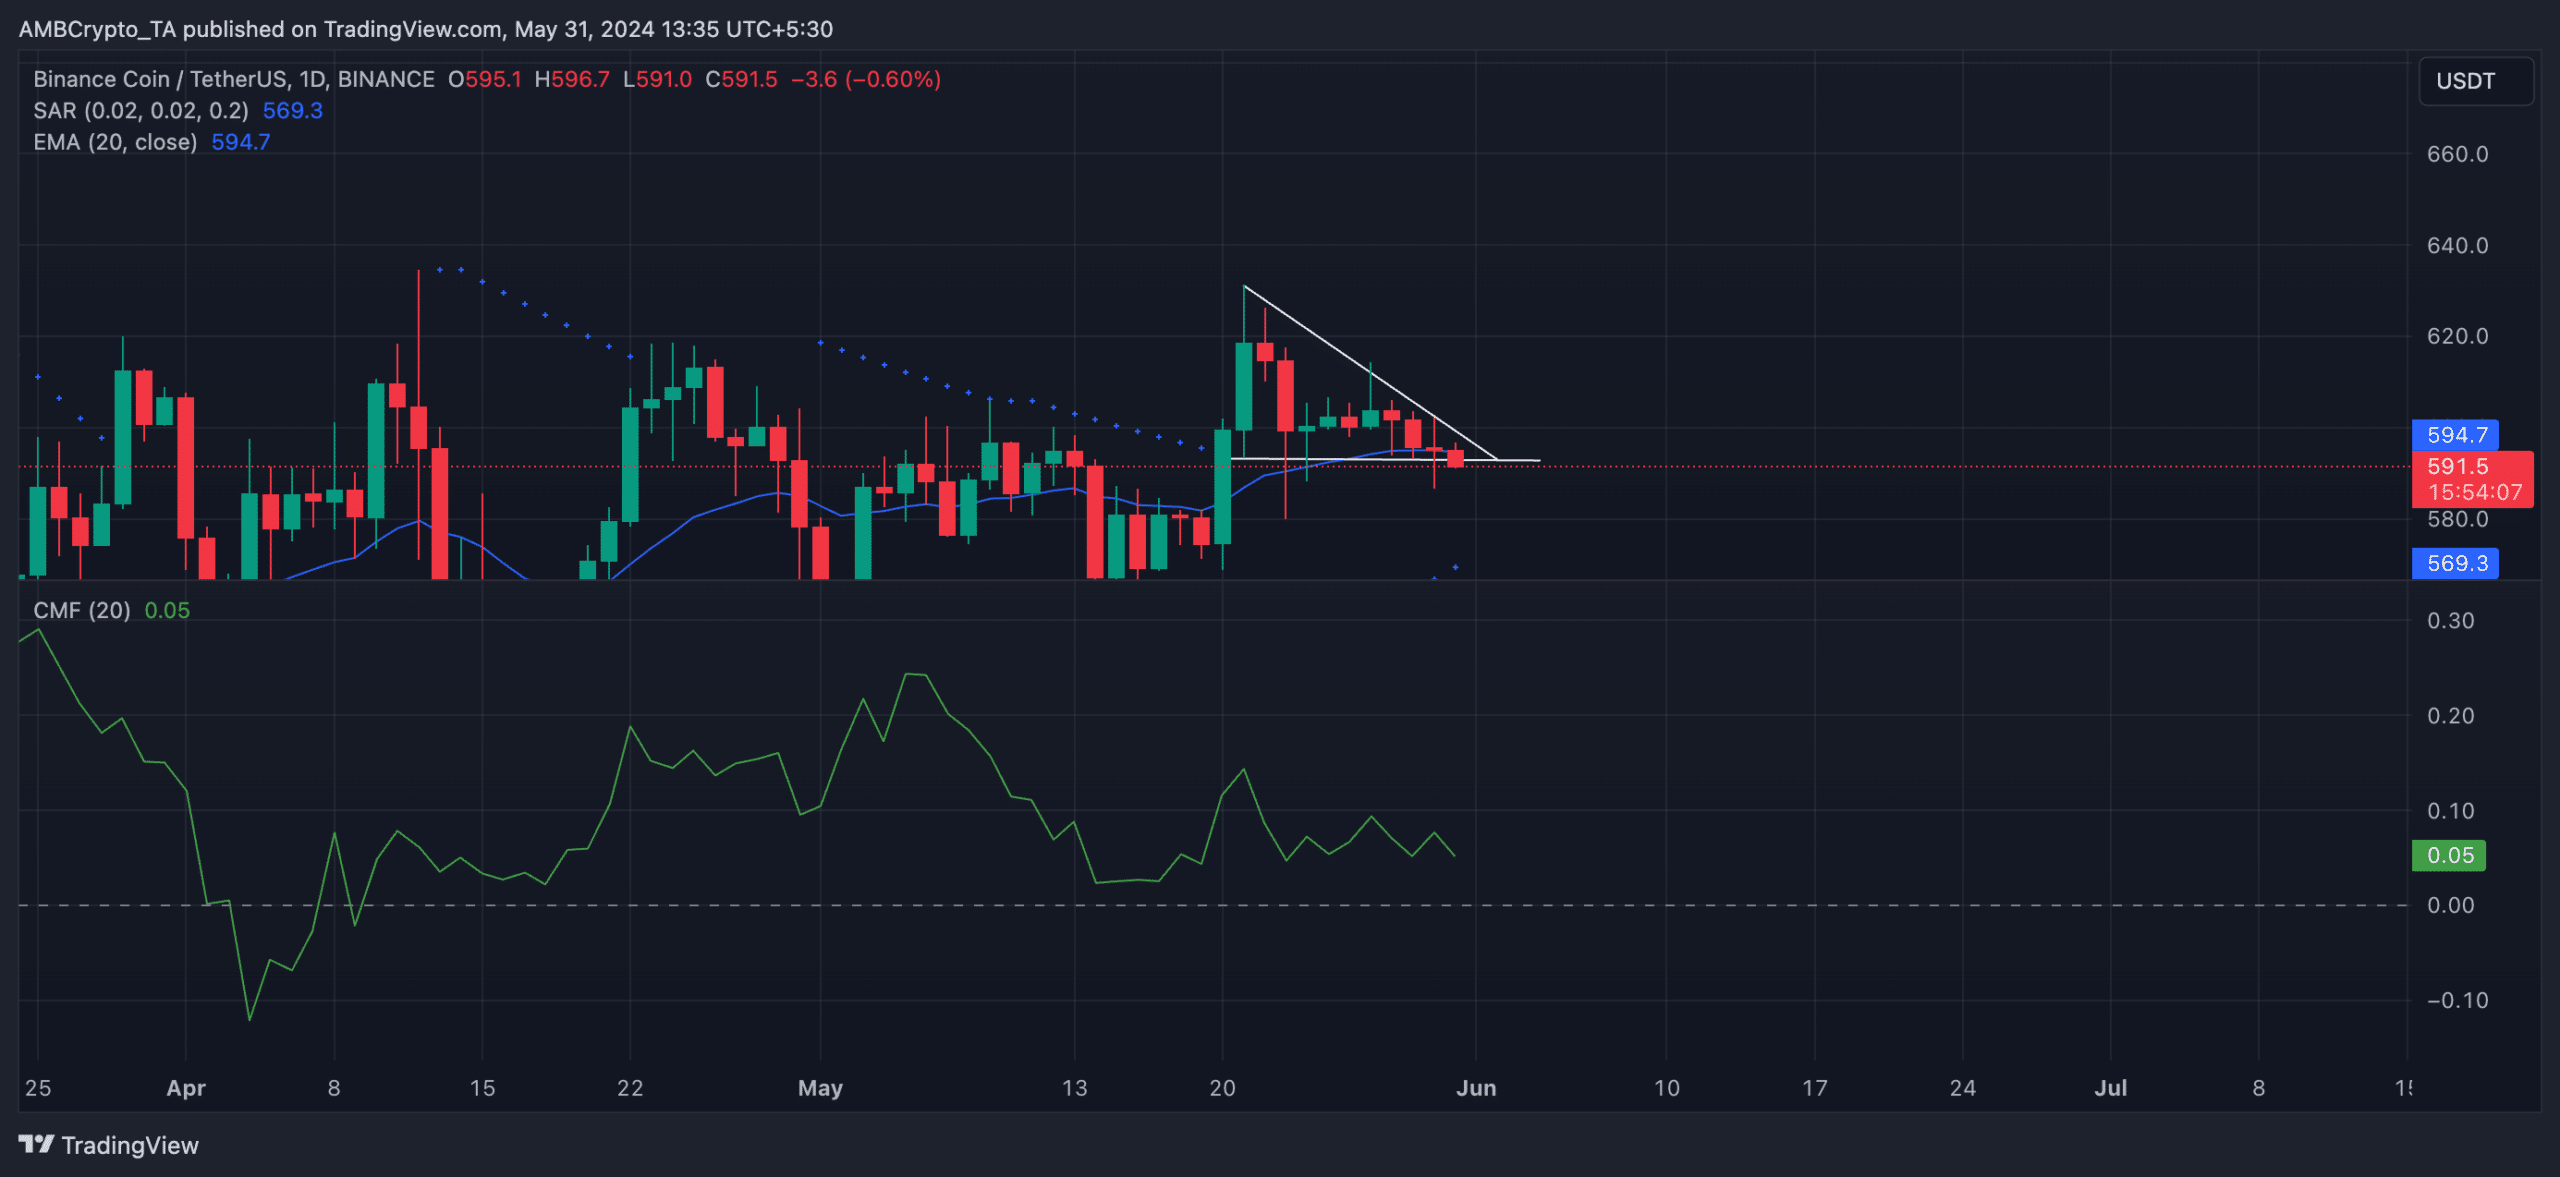
Source: BNB/USDT, TradingView
This bullish signal suggests that traders might be slowly accumulating the altcoin.
Read More: BNB’s next move: Will it break $600 or should you prepare for a plunge?
Disclaimer:The information provided on this website does not constitute investment advice, financial advice, trading advice, or any other sort of advice and you should not treat any of the website’s content as such. coinzoop.com does not recommend that any cryptocurrency should be bought, sold, or held by you. Do conduct your own due diligence and consult your financial advisor before making any investment decisions.